Download the SaaS SEO Guide PDF
Over 60+ page SaaS SEO Guide in PDF format so you can read it whenever you want!


Over 60+ page SaaS SEO Guide in PDF format so you can read it whenever you want!


“What gets measured gets managed” - Peter Drucker
This quote holds true In no industry more so than it does in the fast-paced world of Software as a Service (SaaS) businesses.
Success hinges on understanding, monitoring, and optimizing your organization based on a number of key performance indicators.
These essential metrics offer a real-time snapshot of your SaaS business's health, guiding informed decisions that pave the way for sustainable growth.
This article will delve into the 15 most critical SaaS metrics to monitor and provide strategies for turning the insights gained from that data into actionable steps to grow and improve your business.
SaaS metrics are specific data points that reveal the health and performance of a Software as a Service (SaaS) company. They serve as quantifiable indicators of growth, customer behavior, financial efficiency, and overall success. By tracking and analyzing these metrics, SaaS businesses can make informed decisions about their strategies, optimize operations, and drive long-term growth.
Understanding and monitoring SaaS metrics is critical for the growth and sustainability of any SaaS business. These metrics offer a clear picture of a company's performance and signal any potential issues.
Additionally, they provide insights into customer behavior, enabling businesses to tailor their strategies to their customers' needs. By doing so, businesses can improve customer retention, accelerate growth, and maximize profitability.
If you ever seek to exit or raise funding for your SaaS, it’s also imperative that you have your finger on the pulse of these metrics. Any buyer or investor will require these as table stakes to make an informed decision before buying or investing.
Every SaaS company seeking meaningful growth should focus on these 15 essential metrics that can provide clarity to accelerate growth and optimize business performance.
Recurring revenue is perhaps the most fundamental SaaS metric. It refers to the predictable revenue stream generated by your subscription-based model. Depending on your billing cycle, this could be through Monthly Recurring Revenue (MRR) or Annual Recurring Revenue (ARR).
MRR = (Number of Customers) x (Average Revenue Per User (ARPU))
ARR = MRR x 12
Recurring revenue is vital because it forms the foundation of a sustainable SaaS business. This metric provides a clear picture of your core income, allowing you to forecast growth, make sound financial decisions, and understand the overall health of your business.
Key factors impacting recurring revenue include new customer acquisition, churn rate (customers who cancel subscriptions), expansion revenue (increased revenue from existing customers through upgrades), and contraction revenue (lost revenue due to downgrades). Improving this metric requires a holistic approach that includes refining your customer acquisition strategy, reducing customer churn, and increasing average customer lifetime value.
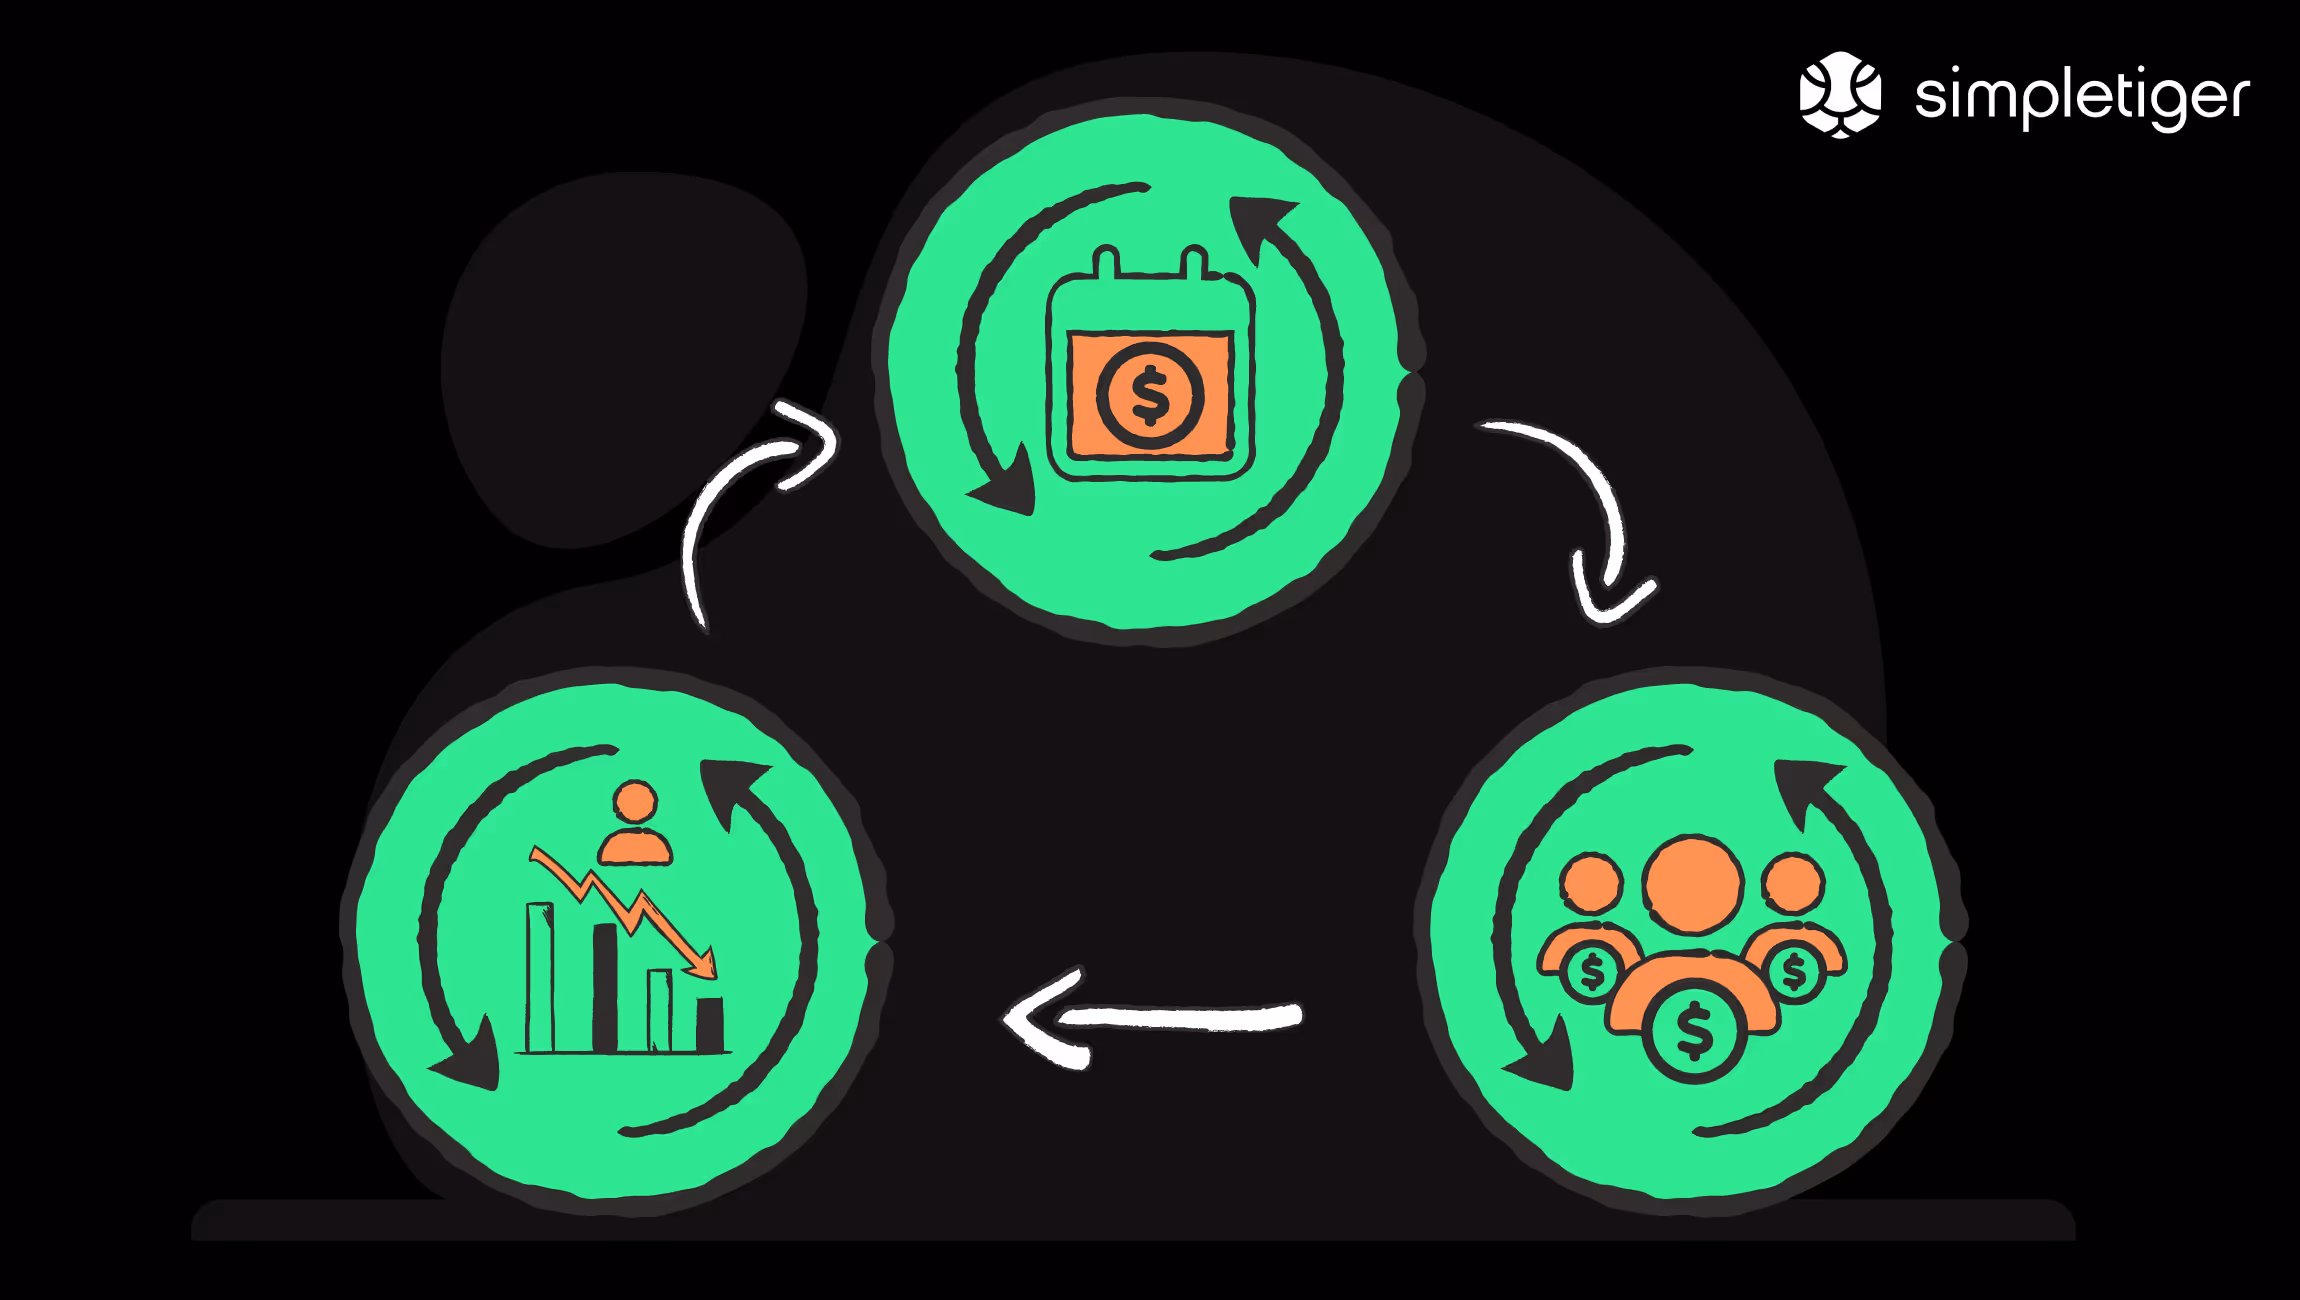
Revenue churn is the percentage of recurring revenue lost monthly due to cancellations and downgrades. Like a leaky bucket, high churn means less money to reinvest in growth.
Revenue Churn = (MRR lost from downgrades or cancellations in the period / MRR at the start of the period) x 100
Churn hinders growth and can signal customer dissatisfaction. Addressing churn is crucial to maintaining a healthy cash flow. You have to remember, too, that you’ve already paid to acquire these customers in some way (sales, marketing), so your cost to acquire a customer (CAC) is less effective over a long-term span if you have high revenue churn.
Several factors affect churn, including customer satisfaction, product value, and pricing. By focusing on these areas, you can improve customer experience, ensure your product delivers value, and optimize pricing, ultimately plugging the leaks and keeping your revenue flowing smoothly.
The Customer Lifetime Value (CLV) is a critical SaaS metric that helps estimate the total revenue a business can reasonably expect from a single customer over the course of their business relationship. It takes into account factors like average purchase value, average purchase frequency rate, and customer lifespan.
CLV = (Average Revenue Per User (ARPU) x Customer Lifespan (in months))
This metric matters as it provides insights into how much value customers are bringing to your business over an extended period. By understanding this, you can make informed decisions about how much you should be willing to spend on customer acquisition and retention.
CLV can be affected by various factors, like the quality of your customer service, the user experience, and the effectiveness of your customer retention strategies. Improving this metric relies heavily on elevating user satisfaction and ensuring customer loyalty. The effectiveness of your solution compared to competitors can also impact this, so keep a finger on the pulse of what users need from your solution and always try to stay a step ahead of the competition in delivering value.
The Customer Acquisition Cost (CAC) is a key SaaS metric that refers to the total cost your business incurs to acquire a new customer. This includes all marketing and sales expenses divided by the total number of customers acquired during a specific period.
CAC = (Total sales & marketing expenses in a period) / (Number of new customers acquired in that period)
Monitoring CAC can reveal insights about your business performance and marketing efforts' efficiency. It's a window to evaluate investment return, assisting in understanding if you're spending too much or too little on customer acquisition. If CAC is high, more resources are consumed for every customer, affecting profitability.
Numerous factors can affect CAC - marketing strategy efficiency, competitive market, product price, and more. To improve CAC, optimize your sales and marketing strategies and focus more on retaining existing customers, as acquiring new customers may cost up to 5 times more than retaining an existing one. (Source)
Moreover, you can streamline customer acquisition using content marketing or referral programs.
Your growth rate measures how quickly your customer base or revenue is expanding over a specific period, typically a month or year. It shows if your business is gaining momentum.
MRR Growth Rate = ((MRR at the end of the period - MRR at the start of the period) / MRR at the start of the period) x 100
A positive growth rate indicates you're acquiring new customers and increasing revenue, putting your business on a healthy track.
Various factors can influence your growth rate, including marketing effectiveness, sales success, and product adoption. Monitoring and optimizing these areas can help you accelerate your growth trajectory.
Net New MRR is the additional monthly recurring revenue generated from new customer acquisitions in a given month. It reflects the immediate revenue impact of your customer acquisition efforts.
Net New MRR = MRR from new customers - MRR lost from churn or downgrades
Net New MRR is crucial for sustainable growth. It shows your ability to attract new customers and bring in fresh revenue streams.
The effectiveness of your marketing and sales efforts, along with your pricing strategy, directly impacts the number of new customers you acquire and the revenue they generate.
Marketing campaigns, sales outreach, and competitive pricing strategies can all contribute to increasing your net new MRR, ultimately expanding your revenue pie.
Expansion MRR is the additional monthly recurring revenue generated from existing customers upgrading their plans, purchasing add-ons, or increasing their usage in a given month.
Expansion MRR = Upsell/cross-sell revenue + Increased usage revenue from existing customers in a period.
Expansion MRR signifies you're maximizing the value you deliver to existing customers, fostering loyalty, and increasing revenue without relying solely on new acquisitions.
Your ability to keep customers happy, demonstrate product value, and offer enticing upgrade options directly influences expansion MRR.
Providing excellent customer service, offering valuable upgrades, and implementing successful upselling and cross-selling strategies can help you unlock the potential of your existing customer base and boost your expansion MRR.
The CAC Payback Period is a SaaS metric that indicates the period it takes for a company to earn back the amount spent on acquiring a new customer. This involves factoring in costs associated with sales, marketing, software development, and other expenses related to customer acquisition.
CAC Payback Period = Customer Acquisition Cost (CAC) / Monthly Recurring Revenue (MRR)
It offers insights into your financial health and long-term sustainability. A prolonged CAC Payback Period might signal inefficiencies in your sales, marketing strategies, or pricing model. You know you're on the right path when the time to earn back acquisition expenses is shorter, leading to faster profitability.
Significant factors affecting your CAC Payback Period include your pricing strategy, the effectiveness of your sales and marketing efforts, the efficiency of your onboarding process, and the value provided by your product.
Improving your CAC Payback Period starts by understanding these influencing factors. To enhance customer retention, you could focus on strategies like increasing customer lifetime value (LTV), reducing customer acquisition cost (CAC), and improving service quality.
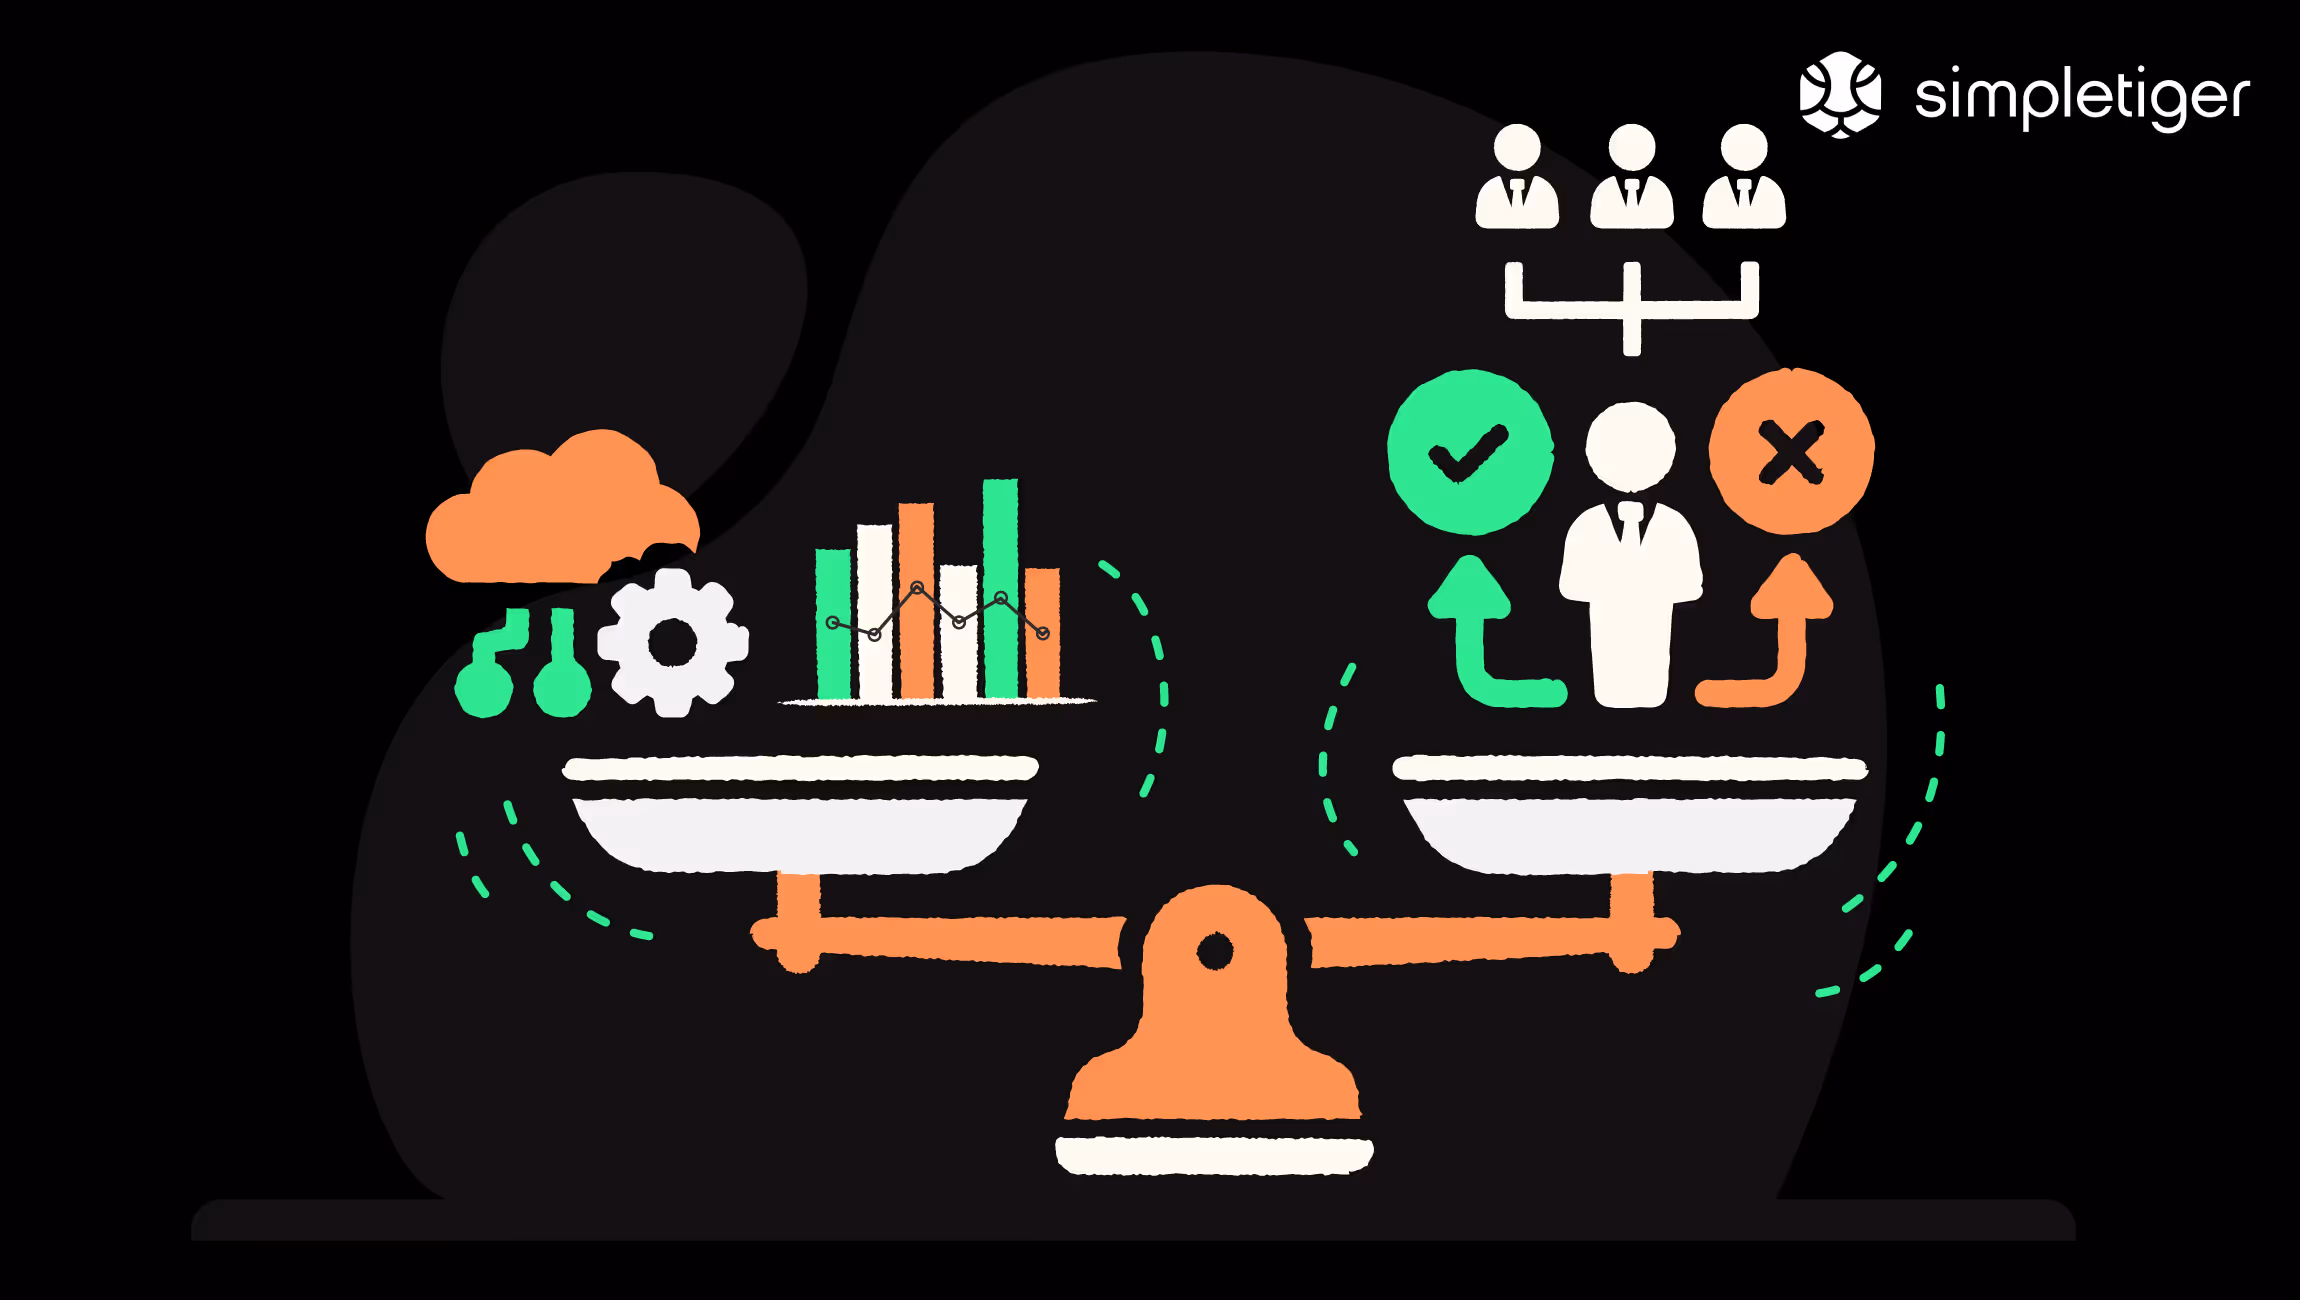
Customer Lifetime Value (LTV) to Customer Acquisition Cost (CAC) Ratio is a critical SaaS metric that provides insights into the profitability and sustainability of your customer acquisition strategies. It compares the cost you spend on acquiring a new customer (CAC) to the total revenue you can expect to generate from that customer over their lifetime (LTV).
LTV: CAC = Customer Lifetime Value (LTV) / Customer Acquisition Cost (CAC)
This metric matters because it helps SaaS companies understand how effective their marketing and sales strategies are. A low ratio could indicate that you're spending too much on customer acquisition, which could lead to losses in the long run.
On the flip side, a high ratio could suggest that you're not investing enough in reaching new customers, potentially limiting your growth potential.
Understanding your LTV:CAC ratio can help you understand when and if you should scale investment into specific customer acquisition channels due to their efficiency and payback window.
One factor is the cost-effectiveness of your marketing strategies. Efficient strategies can lead to lower CAC and a higher ratio. Likewise, strategies designed to maximize customer retention can result in higher LTV and a more favorable ratio.
Conversely, a high churn rate (i.e., a large number of customers leaving your service) can reduce LTV and make your ratio less favorable.
To improve your LTV: CAC ratio, you can focus on both sides of the equation. On the CAC side, optimizing your marketing strategies and improving conversion rates can help reduce the cost of acquiring new customers. On the LTV side, improving your product, providing excellent customer support, and offering loyalty incentives can help increase customer lifetime value.
It’s also very important to segment the peformance of each marketing and sales channel and even campaigns within each marketing or sales channel. For example, SEO may be significantly more efficient from an LTV: CAC standpoint than PPC is for your business, so you know if you scale your SEO investment, you will get more revenue back from each dollar you spend in that channel.
On a deeper level, there may be pages or sections of your site that generate more conversions and have a better LTV:CAC ratio from within SEO. You will want to ensure you’re doubling down on what works. Segmenting can help you direct effort more granularly in this way.
Also known as churn rate, Customer Churn Rate measures the number of customers you're losing over a particular duration compared to the number you had at the start. A high churn rate, therefore, directly correlates to lost revenue and indicates dissatisfaction among your existing customer base.
Customer Churn Rate = (Customers lost in the period / Customers at the start of the period) x 100
Keeping tabs on churn can provide invaluable insights into your operation's overall health. An increased churn rate signifies that customers aren’t satisfied for some reason, be it poor customer service, a lack of product features, or even a competitive market. Reducing your churn rate promotes retention and, as a result, increases profit margins.
You can manage this metric by delivering consistently satisfying user experiences and reliable customer service to keep customers from looking elsewhere. Also, getting direct feedback from your customers allows you to figure out what’s not working and correct those aspects.
As proven by Harvard Business Review, it’s far more expensive to acquire new customers than it is to retain existing ones, which makes reducing your churn rate all the more critical.
NPS is a single-question survey that asks customers how likely they are to recommend your company on a scale of 0 to 10. Responses are categorized into Detractors (0 to 6), Passives (7 to 8), and Promoters (9 to 10).
NPS = (% of Promoters [9-10]) - (% of Detractors [0-6])
NPS provides a quick and insightful snapshot of customer loyalty. High scores indicate satisfied customers who can become brand advocates, driving organic growth and positive brand perception.
Customer experience, product satisfaction, and addressing customer feedback directly impact NPS. Focus on delivering exceptional service, ensuring product value, and actively addressing feedback to cultivate loyal promoters and boost your score.
CRR measures the percentage of customers who remain your customers over a specific period. It reflects your ability to retain valuable customers and minimize churn.
CRR = ((Number of customers at the end of the period - Number of new customers acquired during the period) / Number of customers at the start of the period) x 100
A high CRR signifies customer satisfaction and loyalty, leading to recurring revenue and reduced customer acquisition costs. It's crucial for long-term business sustainability.
Several factors influence CRR, including customer satisfaction, product value, and customer service quality. Prioritize customer needs, ensure your product delivers lasting value, and provide excellent customer support to improve satisfaction and keep customers coming back.
DAU/MAU tracks the number of users actively engaging with your product on a daily/monthly basis. They provide insights into user engagement levels and product stickiness.
DAU = Number of unique users interacting with the product on a given day.
MAU = Number of unique users interacting with the product over a month.
High DAU/MAU indicates a user base actively using your product, suggesting value and potential for sustainable growth. Low numbers might signal user churn or lack of product engagement.
The user experience, product value proposition, and user onboarding process all impact DAU/MAU.
To drive user engagement and increase active users, focus on improving usability, ensuring your product addresses user needs, and providing a smooth onboarding experience.
Feature adoption rate measures the percentage of users actively using specific features within your product. It helps understand which features resonate with users and identify areas for improvement.
Feature Adoption Rate = (Number of users who used the feature in a period / Total number of users) x 100
High adoption rates for valuable features indicate user engagement and satisfaction. Low adoption might suggest features are confusing, lack value, or need better promotion.
Feature discoverability, user education, and the perceived value of the feature influence the adoption rate.
Prioritize feature visibility within the interface, offer clear user guides, and highlight the benefits of each feature to encourage users to explore and utilize them effectively.
The Customer Engagement Score (CES) is a metric designed to quantify how actively engaged your customers are with your SaaS product. It's calculated by tracking specific in-app behaviors and user actions that indicate a positive and meaningful interaction with your offering. Parameters for this measurement can include actions like clicks, downloads, comments, the time spent per visit, etc.
Identify key engagement actions your users can take, assign weights to these actions based on their importance, and track user interactions.
Aggregate these interactions over a specific period, applying the weights to each action. This weighted sum represents the engagement score, offering insights into user behavior and preferences.
CES is a leading indicator of customer satisfaction, retention, and potential for revenue expansion. Highly engaged customers are more likely to become loyal advocates, upgrade or expand their usage, and renew subscriptions.
Several factors can influence this metric, such as product quality, user interface, customer support, and overall customer experience. Hence, to improve this metric, companies can invest in UI/UX design, improve customer service, and consistently update their product according to user feedback.
According to SuperOffice, a study found that 86% of buyers are willing to pay more for a great customer experience, emphasizing the impact of customer interaction on businesses.
As you navigate the landscape of SaaS metrics, having the right tools and dashboards can be of great help. Here are five noteworthy SaaS metrics dashboards and tools to help keep you on top of your game:
ChartMogul is a software solution designed specifically for subscription-based businesses. It provides a clear and accurate snapshot of all your key metrics, such as Monthly Recurring Revenue (MRR) or Annual Recurring Revenue, churn rate, and customer lifetime value, among others.
ChartMogul simplifies financial reporting and lead indexing, providing invaluable insights to guide your growth strategy.
Designed especially for companies using Stripe, Braintree, Google Play, or the App Store, Baremetrics offers a set of tools for analyzing revenue, churn, and other key metrics. A standout feature is the One-Click, Zero-Setup subscription, which ensures you get the data you need effortlessly.
Klipfolio is a cloud-based dashboard software that allows you to pull data from multiple sources into one centralized view. This robust tool gives you the versatility to monitor various business operations, including sales, marketing, and, of course, SaaS metrics.
The great thing about Klipfolio is its seamless integration with other business tools like Google Analytics and Salesforce.
Maxio is a comprehensive SaaS metrics tool that provides a holistic view of your revenue data. From personnel compensation and billing to revenue recognition and churn, Maxio has you covered. Their real-time, actionable financial metrics give you the granular data needed to optimize and streamline your business operations.
Looker is a modern business intelligence platform that teams of all sizes can use. It provides a persuasive, innovative approach to business intelligence and big data analytics, boasting features that aid in defining and managing metrics.
Looker gives you the ability to manipulate and visualize your data efficiently, so you can focus on the metrics that matter the most.
The 15 critical SaaS metrics we've explored illuminate the path to growth and reveal hidden opportunities. However, to truly capitalize on these insights, you must ensure your SaaS product stands out in the crowded online marketplace.
That's where the power of SEO comes in. By strategically optimizing your website and content, you'll gain visibility, attract high-intent prospects, and fuel long-term growth. The combination of smart data analysis and targeted SEO is the key to sustainable, scalable success.
SimpleTiger is your one-stop solution for achieving this powerful synergy. Our seasoned SEO experts will supercharge your online reach while our robust analytics platform delivers the data clarity you need for strategic decision-making. Experience the difference – book a discovery call today!

Sean is Chief Strategy Officer at SimpleTiger, leading strategic direction & overarching marketing strategy for SimpleTiger clients. Sean's also responsible for navigating the shift from a traditional SEO focus to an AI search-first focus in the B2B SaaS and AI software industry & furthering our position as an industry leading digital marketing agency focused on rapid growth for our clients through search..
Over 60+ pages detailing how to grow your SaaS company using a proven SEO process.
Actionable insights to help you grow your SaaS and dominate your search market!